Cause Effect Graphing Definition
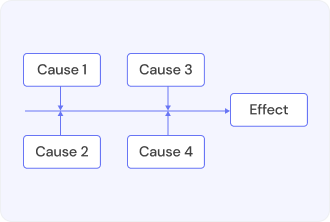
Cause Effect Graphing is referring to a technique used in software engineering that entails the usage of graphs in representation of different outputs and inputs of the system. It is meant to highlight and identify the relationship between the inputs which are causes and outputs which are effects manner.
The outcomes of these tests are then documented as under the condition of combinations. Such a process begins by determining the minimum possible amount of test cases in order to figure out the maximum test coverage for the reduction of time and costs associated with test execution.
However the downside is the need for documentation of all requirements to conduct test cases.
Limitations and challenges of Cause Effect Graphing
The graphs of complex systems with many inputs get so complicated that they eventually become irrelevant and useless. The graph maintenance takes more time than the test.
The approach supposes that the causes and the effects have a strong relation to each other. This is not the case with real software. The inputs get into a collision in a totally unexpected manner when one of them is changed the rest of the system is affected unpredictably. Your graph is not capable of detecting these hidden dependencies.
It is a very time-consuming process to create the initial graph. You need to have a complete documentation of the requirements even before you get started, a situation that hardly exists in reality. And when requirements change (which they always do), you’re back drawing everything.
Besides, there is also a human factor to consider. The manual creation of the graphs is a source of errors. You can easily overlook certain important combinations or if there is a miscommunication and the inputs are not properly connected.
Most of the teams do not have any special tools to work with, therefore they are made to use either whiteboards or general drawing software that is not intended for this kind of work.
Moreover, the method is not very friendly with the scale of the system. Manually handling ten inputs does not seem difficult. But when it comes to fifty inputs, the number of combinations increases dramatically. The arithmetic grows exponentially and all of a sudden, the testing approach that used to be “efficient” requires more test cases than the brute force approach.
Another thing is that to change these charts will be very difficult to do in the future. For every single requirement change, the whole structure is affected and needs to be thoroughly checked to identify problems or to make changes.