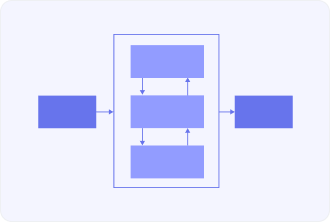
Box Diagram Definition

Box Diagram – is one of the widest spread graphical forms of demonstration of relations, hierarchies or belonging of one or several things to the system, or whole. They are usually depicted with boxes or rectangles linked with lines or arrows to show their connection or interaction. In other words, each of the boxes here is a symbol of some element or component, while the lines or arrows symbolize the relationships, or the flow of information in between.
Box diagrams are in most cases used for the sake of doing the organization and visualization of the complexity of a different information domain like that of mathematics, computer science and engineering to mention but a few, the business fields among many others. They are thus a powerful tool of carrying out analyses as well as solutions to problems in making people understand complex systems easily.
In the scope of usage, they are in use in mathematics and computer science in representation of data structures, algorithms, as wellas process flows. And, in the same breath, business and project management deploy flowcharts in representing organizational charts, project timelines, and flows involved in decision-making. Summing up, these box diagrams play a really important role in simplification of complex information, providing for understanding and effective communication, and applied in lots of spheres — various industries and disciplines.